- 视频总结
- 作业
4 - Loading and Styling Entities - 加载和样式化实体 加载矢量数据
现在我们已经为我们的应用程序设置了Viewer配置、imagery和terrain的阶段,我们可以添加我们的应用程序的主要焦点——geocache数据。
为了便于可视化,Cesium支持流行的矢量格式GeoJson和KML,以及一种我们团队自己开源的格式,我们专门开发用于描述Cesium场景的CZML。
无论初始格式如何,Cesium中的所有空间数据都使用Entity API来表示。Entity API以一种有效提供灵活的可视化的方式,以便对Cesium进行渲染。Cesium Entity是可以与样式化图形表示配对并定位在空间和时间上的数据对象。测试沙盒中提供了许多简单Entity的例子。
以下有一些关于不同entity类型的例子:
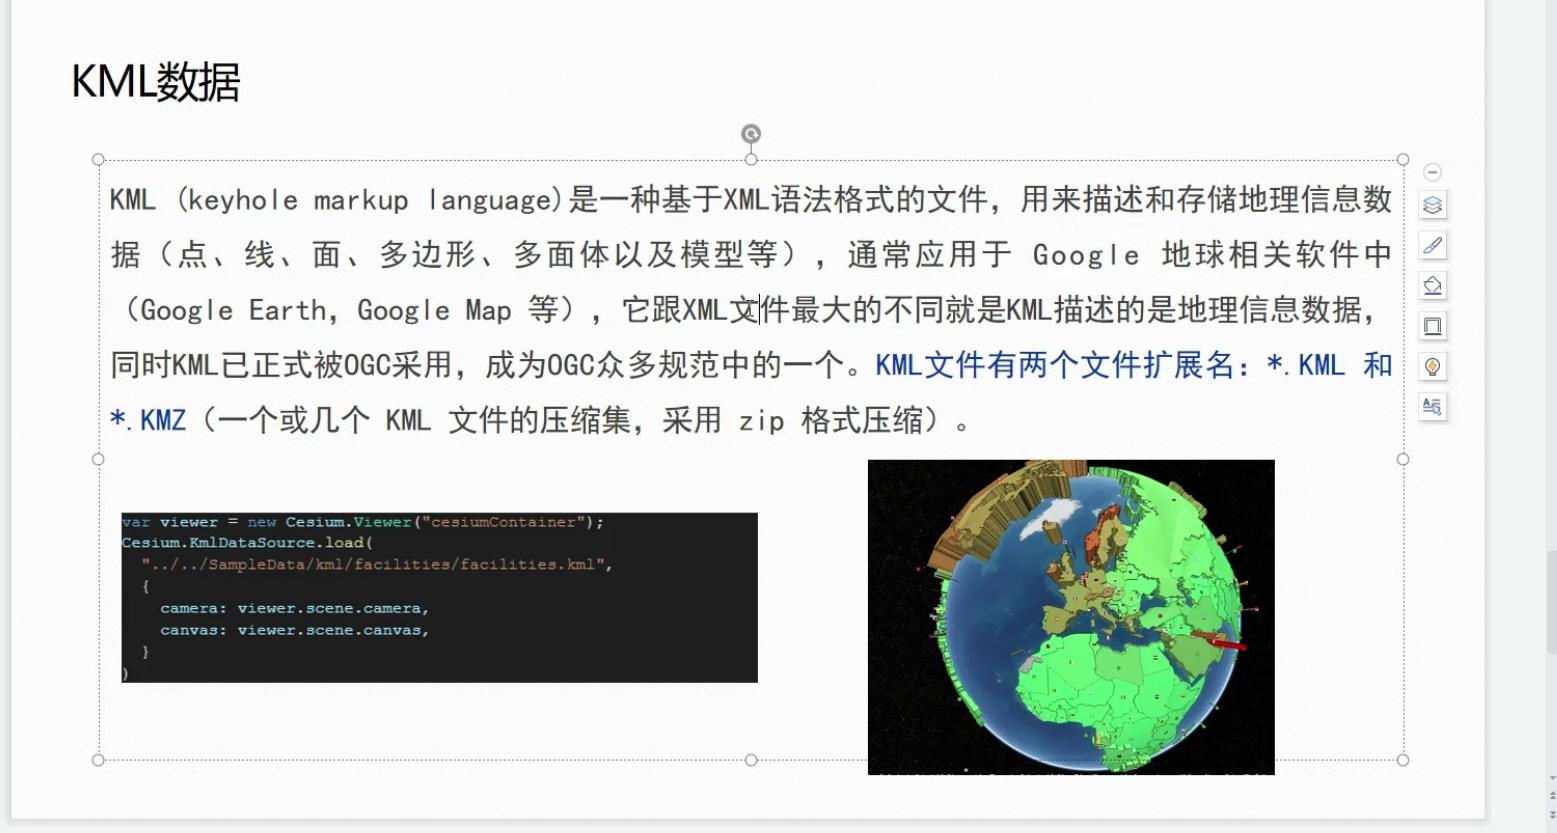
一旦你掌握了一个Entity的样子,用Cesium装载数据集将是变得容易理解。要读取数据文件,需要创建适合于数据格式的数据源DataSource,该数据源将解析在指定URL中承载的数据文件,并为数据集中的每个地理空间对象创建包含Entity的EntityCollection。DataSource只是定义了一个接口——您需要的数据源的确切类型将取决于数据格式。例如,KML使用KmlDataSource源代码。比如:
var kmlOptions = {
    camera : viewer.scene.camera,
    canvas : viewer.scene.canvas,
    clampToGround : true
};
// Load geocache points of interest from a KML file
// Data from : http://catalog.opendata.city/dataset/pediacities-nyc-neighborhoods/resource/91778048-3c58-449c-a3f9-365ed203e914
var geocachePromise = Cesium.KmlDataSource.load('http://111.22.69.99:58080/cesium/Apps/SampleData/kml/facilities/facilities.kml', kmlOptions);
上述代码读取我们样例的geocahce点,从一个KML文件中,调用KmlDataSource.load(optinos)带一些配置。针对一个KmlDataSource,相机和Canvas配置项是必须的。clamptoGround选项激活了ground clamping**,一种流行的描述配置用于是地面的几何entities比如多边形和椭圆符合地形而且遵从WGS84椭圆面。
由于这些数据是异步加载的,因此针对KmlDataSource返回一个的Promise,它将包含我们所有新创建的entities。
如果您不熟悉使用异步函数的PromiseAPI,这里的“异步”基本上意味着您应该在所提供的回调函数中完成所需的数据**.then.为了实际地将这些实体集合添加到场景中,我们必须等待直到promise完成,然后将KmlDataSource添加viewer.datasrouces**。取消以下几行注释:
// Add geocache billboard entities to scene and style them
geocachePromise.then(function(dataSource) {
    // Add the new data as entities to the viewer
    viewer.dataSources.add(dataSource);
});
默认情况下,这些新创建的实体具有有用的功能。单击将显示与实体相关的元数据的信息框Infobox,并双击缩放并查看实体。若要停止查看该实体,请单击“home”按钮,或单击“信息框”上的“划出”相机图标。接下来,我们将添加自定义样式来改善我们的应用程序的外观style。
对于KML和CZML文件,可以在文件中建立声明式样式。然而,对于这个应用,让我们练习手动设计我们的实体。要做到这一点,我们将采取类似的方法来处理[这个样式示例](http://111.22.69.99:58080/cesium/Apps/Sandcastle/?src=GeoJSON and TopoJSON.html&label=Showcases),等待我们的数据源加载,然后迭代数据源集合中的所有实体,修改和添加属性。默认情况下,我们的geocache点标记被创建为Billboards和Labels,所以为了修改这些实体的外观,我们这样做:
// Add geocache billboard entities to scene and style them
geocachePromise.then(function(dataSource) {
    // Add the new data as entities to the viewer
    viewer.dataSources.add(dataSource);

    // Get the array of entities
    var geocacheEntities = dataSource.entities.values;

    for (var i = 0; i < geocacheEntities.length; i++) {
        var entity = geocacheEntities[i];
        if (Cesium.defined(entity.billboard)) {
            // Entity styling code here
        }
    }
});
我们可以通过调整它们的锚点、去除标签来减少clutter和设置isplayDistanceCondition来改善标记的外观,使得只有在距相机的一定距离内的点是可见的。
// Add geocache billboard entities to scene and style them
if (Cesium.defined(entity.billboard)) {
    // Adjust the vertical origin so pins sit on terrain
    entity.billboard.verticalOrigin = Cesium.VerticalOrigin.BOTTOM;
    // Disable the labels to reduce clutter
    entity.label = undefined;
    // Add distance display condition
    entity.billboard.distanceDisplayCondition = new Cesium.DistanceDisplayCondition(10.0, 20000.0);
}
有关distanceDisplayCondition的更多帮助,请参见[http://111.22.69.99:58080/cesium/Apps/Sandcastle example](http://111.22.69.99:58080/cesium/Apps/Sandcastle/?src=Distance Display Conditions.html&label=Showcases)。
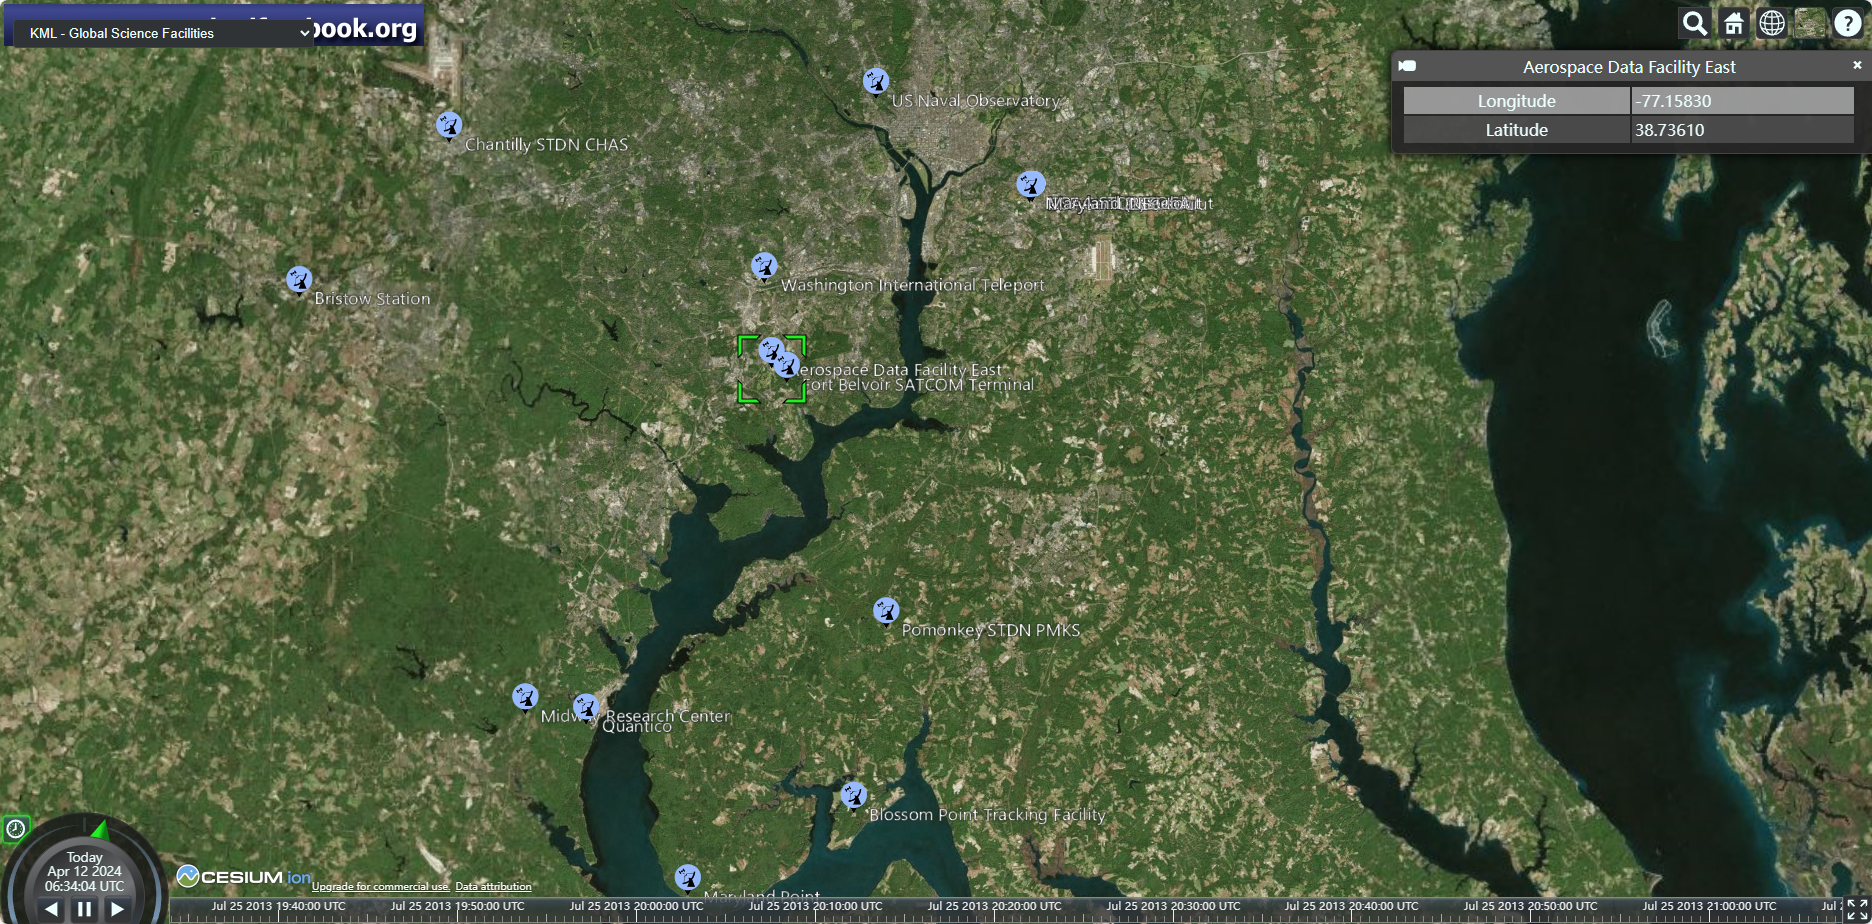
接下来,让我们为每个geocache实体改进信息框Infobox。信息框的标题是实体名称,内容是实体描述,显示为HTML。
你会发现默认的描述并不是很有帮助。由于我们正在显示geocache 位置,让我们更新它们来显示点的经度和纬度。
首先,我们将实体的位置转换成地图,然后从Cartographic中读取经度和纬度,并将其添加到HTML表中的描述中。
在单击时,我们的geocache 实体现在将显示一个格式良好的信息框Infobox,只需要我们所需要的数据。
// Add geocache billboard entities to scene and style them
if (Cesium.defined(entity.billboard)) {
    // Adjust the vertical origin so pins sit on terrain
    entity.billboard.verticalOrigin = Cesium.VerticalOrigin.BOTTOM;
    // Disable the labels to reduce clutter
    entity.label = undefined;
    // Add distance display condition
    entity.billboard.distanceDisplayCondition = new Cesium.DistanceDisplayCondition(10.0, 20000.0);
    // Compute longitude and latitude in degrees
    var cartographicPosition = Cesium.Cartographic.fromCartesian(entity.position.getValue(Cesium.JulianDate.now()));
    var longitude = Cesium.Math.toDegrees(cartographicPosition.longitude);
    var latitude = Cesium.Math.toDegrees(cartographicPosition.latitude);
    // Modify description
    // Modify description
    var description = '<table class="cesium-infoBox-defaultTable cesium-infoBox-defaultTable-lighter"><tbody>' +
        '<tr><th>' + "Longitude" + '</th><td>' + longitude.toFixed(5) + '</td></tr>' +
        '<tr><th>' + "Latitude" + '</th><td>' + latitude.toFixed(5) + '</td></tr>' +
        '</tbody></table>';
    entity.description = description;
}
我们的geocache标记现在应该看起来像这样:
对于我们的地理应用程序来说,可视化特定点的邻域也会有帮助。让我们试着为每个国家加载一个包含多边形的GeoJson文件。加载GeoJson文件最终非常类似于我们刚刚用于KML的加载过程。但是在这种情况下,我们使用GeoJsonDataSource。与前一个数据源一样,我们需要将它添加到viewer.datasources中,以便实际添加数据到场景中。
var geojsonOptions = {
    clampToGround : true,
    camera: viewer.scene.camera,
    canvas: viewer.scene.canvas,
    screenOverlayContainer: viewer.container,
};
// Load neighborhood boundaries from KML file
var neighborhoodsPromise = Cesium.GeoJsonDataSource.load('http://111.22.69.99:58080/cesium/Apps/SampleData/kml/gdpPerCapita2008.kmz', geojsonOptions);

// Save an new entity collection of neighborhood data
var neighborhoods;
neighborhoodsPromise.then(function(dataSource) {
    // Add the new data as entities to the viewer
    viewer.dataSources.add(dataSource);
});
让我们来调整我们加载的neighborhood多边形。就像我们刚才做的billboard样式一样,我们首先在数据源加载后迭代遍历neighborhood 数据源实体,这次检查每个实体的多边形被定义:
// Save an new entity collection of neighborhood data
var neighborhoods;
neighborhoodsPromise.then(function(dataSource) {
    // Add the new data as entities to the viewer
    viewer.dataSources.add(dataSource);
    neighborhoods = dataSource.entities;

    // Get the array of entities
    var neighborhoodEntities = dataSource.entities.values;
    for (var i = 0; i < neighborhoodEntities.length; i++) {
        var entity = neighborhoodEntities[i];

        if (Cesium.defined(entity.polygon)) {
            // entity styling code here
        }
    }
});
既然我们正在显示neighborhood,让我们重命名每个实体使用neighborhood作为它的名字。我们所读的neighborhood中原始GeoJson文件作为属性。Cesium将GeoJson属性存储在enty.properties中,这样我们就可以设置这样的neighborhood名称:
// entity styling code here

// Use geojson neighborhood value as entity name
entity.name = entity.properties.neighborhood;
我们可以把每一个多边形分配给一个新的颜色材料属性,通过ColorMaterialProperty设置随机颜色Color,而不是把所有的区域都设置成一样的颜色。
// entity styling code here

// Set the polygon material to a random, translucent color.
entity.polygon.material = Cesium.Color.fromRandom({
    red : 0.1,
    maximumGreen : 0.5,
    minimumBlue : 0.5,
    alpha : 0.6
});

// Tells the polygon to color the terrain. ClassificationType.CESIUM_3D_TILE will color the 3D tileset, and ClassificationType.BOTH will color both the 3d tiles and terrain (BOTH is the default)
entity.polygon.classificationType = Cesium.ClassificationType.TERRAIN;
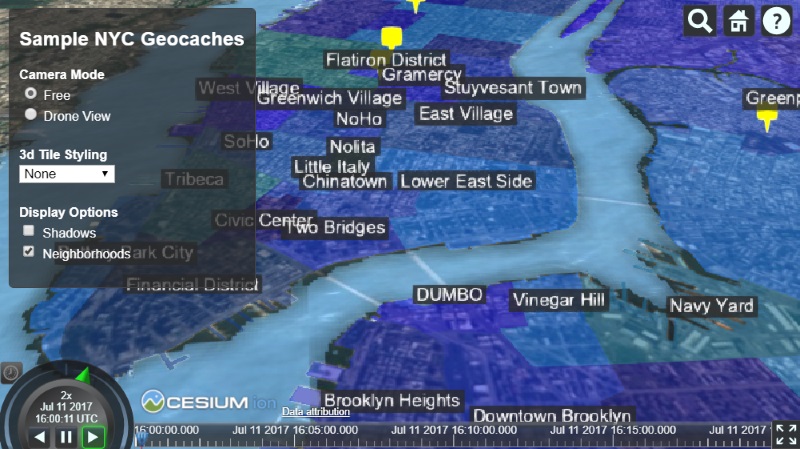
最后,让我们为每个实体生成一个带有一些基本样式选项的标签Label。为了保持整洁,我们可以使用disableDepthTestDistance让Cesium总是把标签放在任何3D物体可能遮挡的地方。
然而,请注意,标签总是位于entity.position。多边形Polygon是由一个未定义的位置创建的,因为它有一个定义多边形边界的位置列表。我们可以通过取多边形位置的中心来生成一个位置:
// entity styling code here

// Generate Polygon position
var polyPositions = entity.polygon.hierarchy.getValue(Cesium.JulianDate.now()).positions;
var polyCenter = Cesium.BoundingSphere.fromPoints(polyPositions).center;
polyCenter = Cesium.Ellipsoid.WGS84.scaleToGeodeticSurface(polyCenter);
entity.position = polyCenter;
// Generate labels
entity.label = {
    text : entity.name,
    showBackground : true,
    scale : 0.6,
    horizontalOrigin : Cesium.HorizontalOrigin.CENTER,
    verticalOrigin : Cesium.VerticalOrigin.BOTTOM,
    distanceDisplayCondition : new Cesium.DistanceDisplayCondition(10.0, 8000.0),
    disableDepthTestDistance : 100.0
};
这给我们标出了看起来像这样的多边形:
最后,让我们通过在太空添加飞行飞行来展示不同的视角。
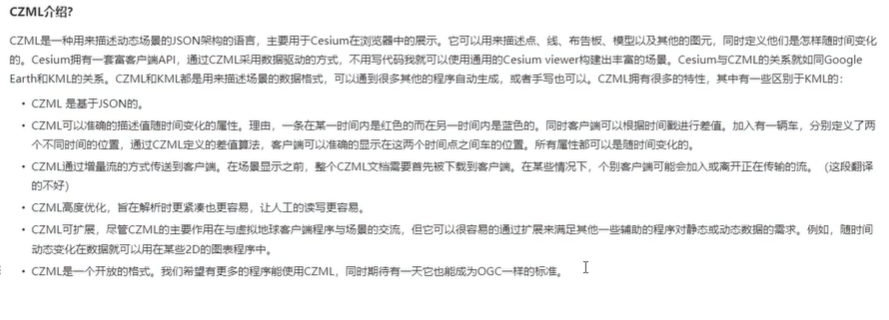
由于飞行路径只是一系列随时间变化的位置,所以我们可以从CZML文件中添加这些数据。CZML是一种用于描述时间动态图形场景的格式,主要用于在运行Cesium的Web浏览器中显示。它描述了线、点、billboards、模型和其他图形原语,并指定它们如何随时间变化。CZML之于Cesium,相当于KML之于谷歌地球的标准格式,它允许大多数Cesium功能特性通过声明式样式语言(在这种情况下是JSON模式)使用。
我们的CZML文件定义了一个实体(默认为可视化的一个点),其位置被定义为在不同时间点的一系列位置。实体API中有几种属性类型可用于处理时间动态数据。参见下面的演示示例:
const viewer = new Cesium.Viewer("cesiumContainer", {
	terrain: Cesium.Terrain.fromWorldTerrain(),
	baseLayerPicker: false,
	shouldAnimate: true,
});

const dataSource = await viewer.dataSources.add(
	Cesium.CzmlDataSource.load(
  		"http://111.22.69.99:58080/cesium/Apps/SampleData/simple.czml"
	)
);
CZML文件使用Cesium来显示卫星飞行,该路径是实体随时间显示其位置的属性。一条路径用插值法将离散点连接到一条连续的直线上进行可视化。 最后,让我们改善无人机飞行的外观。首先,而不是简单地解决问题,我们可以加载一个3D模型来表示我们的无人机并将其附加到实体上。
- [3D Model Demo](http://111.22.69.99:58080/cesium/Apps/Sandcastle/?src=3D Models.html&label=Showcases)
- [3D Model Coloring Demo](http://111.22.69.99:58080/cesium/Apps/Sandcastle/?src=3D Models Coloring.html&label=Showcases)
Cesium支持基于glTF(GL传输格式)加载3D模型,这是Cesium团队与Khronos group一起开发的开放规范,用于通过最小化文件大小和运行时间处理来有效地加载应用程序的3D模型。没有gLTF模型吗?我们提供了一个在线转换器,将COLLADA和OBJ文件转换为glTF格式。
让我们加载一个无人机模型Model,具有良好的基于物理的阴影和一些动画:
var drone;
dronePromise.then(function(dataSource) {
    viewer.dataSources.add(dataSource);
    // Get the entity using the id defined in the CZML data
    drone = dataSource.entities.getById('Aircraft/Aircraft1');
    // Attach a 3D model
    drone.model = {
        uri : 'http://111.22.69.99:58080/cesium/Apps/SampleData/Models/CesiumDrone.gltf',
        minimumPixelSize : 128,
        maximumScale : 1000,
        silhouetteColor : Cesium.Color.WHITE,
        silhouetteSize : 2
    };
});
现在我们的模型看起来不错,但与原来的点不同,无人机模型具有方向性,当无人驾驶飞机向前移动时,它看起来很奇怪。幸运的是,Cesium提供了一种VelocityOrientationProperty,它将根据一个实体向前和向后采样的位置自动计算方向:
// Add computed orientation based on sampled positions
drone.orientation = new Cesium.VelocityOrientationProperty(drone.position);
现在我们的无人驾驶飞机模型将如期进行。
还有一件事我们可以做的是改善我们的无人机飞行的外观。从远处看,它可能并不明显,但无人机的路径是由看起来不自然的线段组成的,这是因为Cesium使用线性插值来构建从默认采样点的路径。然而,可以配置插值选项。
为了获得更平滑的飞行路径,我们可以改变这样的插值选项:
// Smooth path interpolation
drone.position.setInterpolationOptions({
    interpolationDegree : 3,
    interpolationAlgorithm : Cesium.HermitePolynomialApproximation
});
视频总结
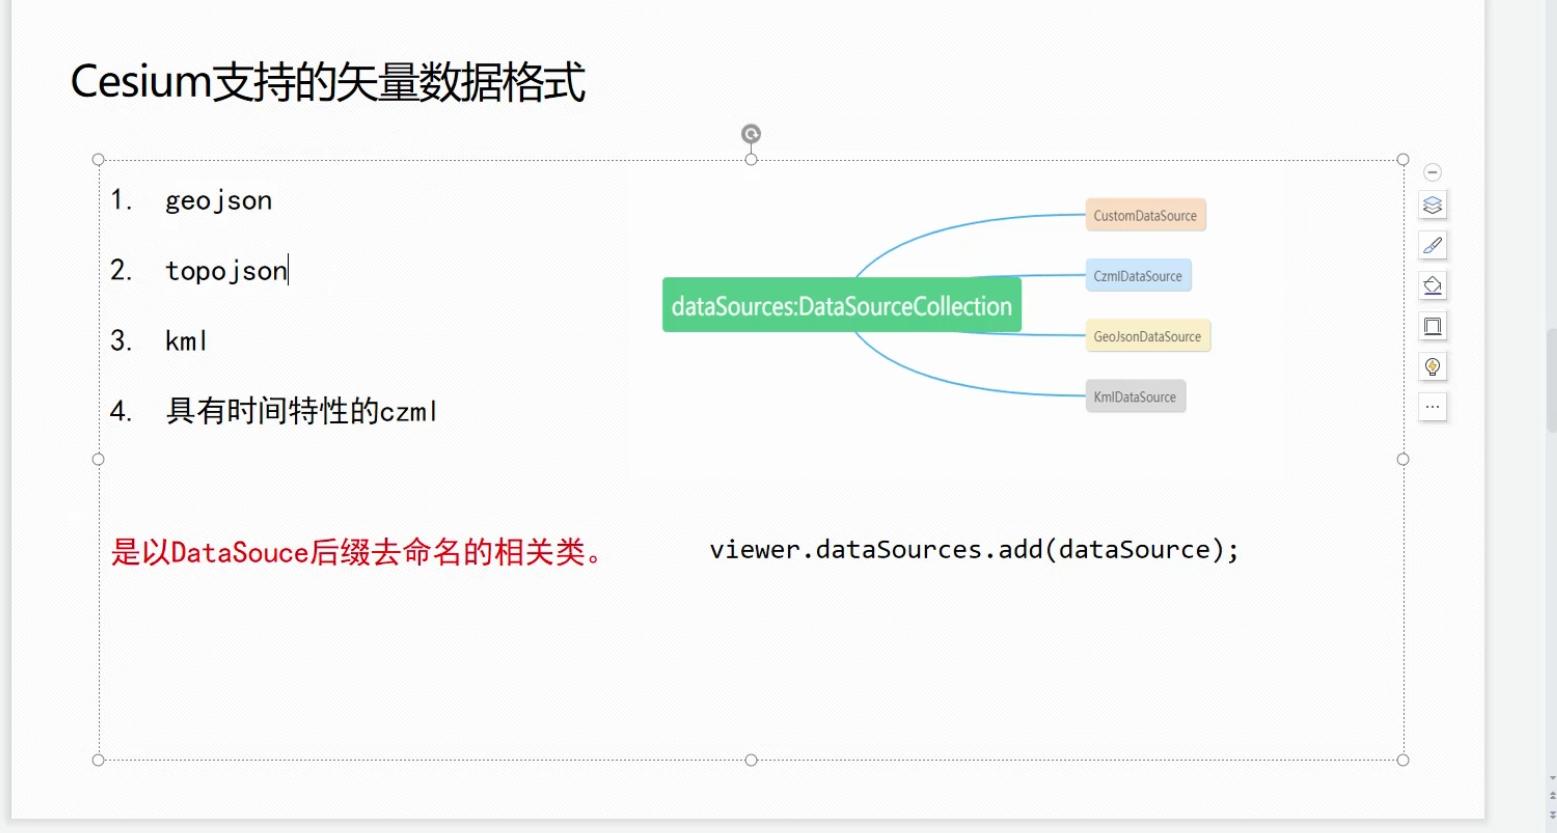
(1)Cesium支持的矢量数据格式有:geojson、topojson、kml、具有时间特性的czml。
DataSourceCollection有:
CustomDataSource、CzmlDataSource、GeoJsonDataSource、KmlDataSource
Cesium添加CustomDataSource,是Cesium自定义的数据类型,比如entity:
const dataSource = new Cesium.CustomDataSource('myData');

const entity = dataSource.entities.add({
   position : Cesium.Cartesian3.fromDegrees(1, 2, 0)
});

viewer.dataSources.add(dataSource);
(2)Topjson介绍:
在线生成TopoJSON和GeoJSON的网站:https://geojson.io/
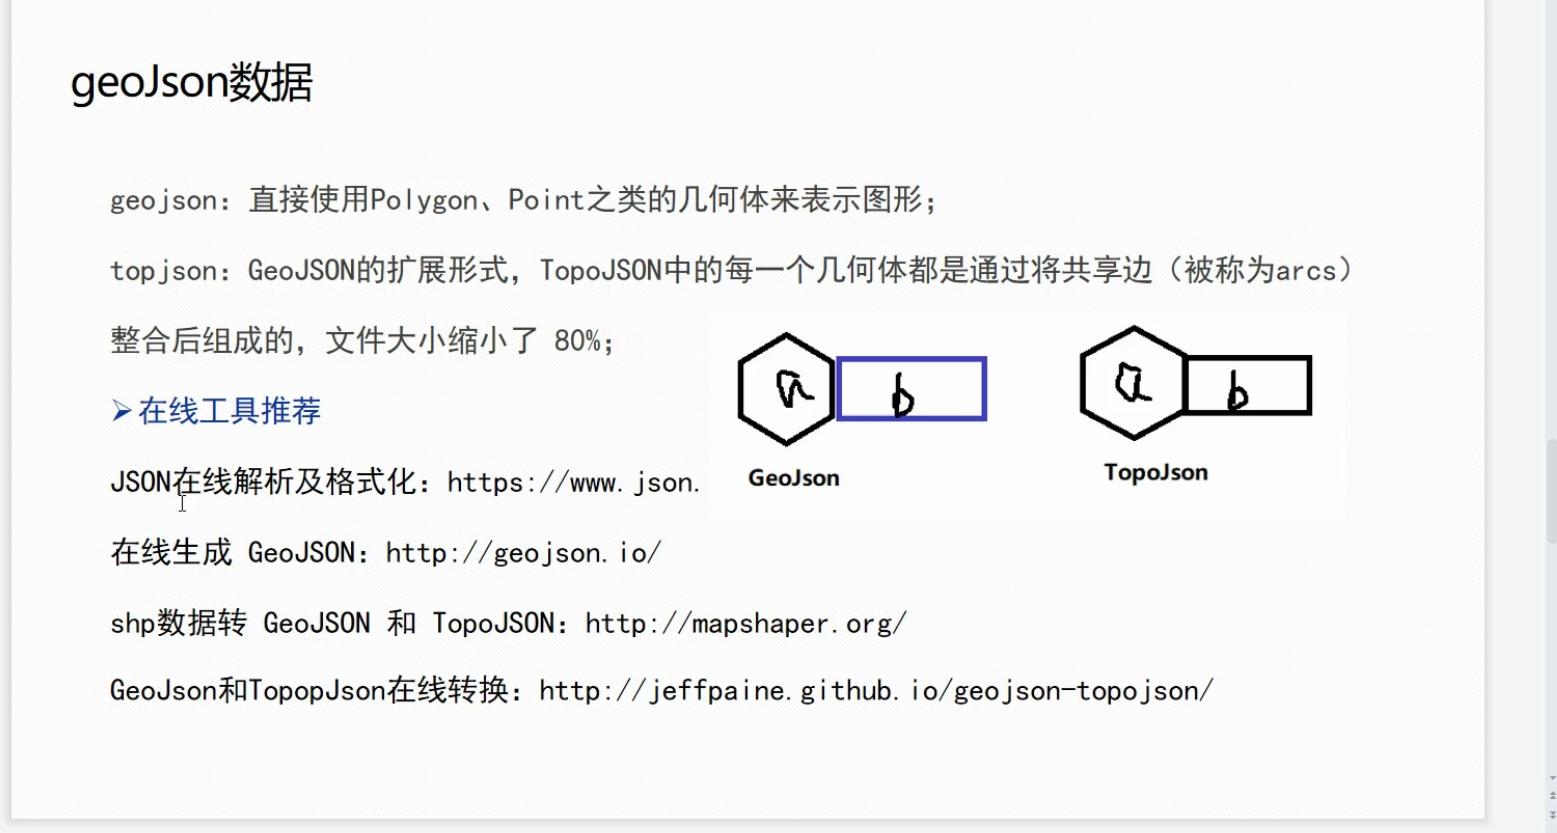
topojson和geojson面数据示例:
{"type":"Topology","objects":{"collection":{"type":"GeometryCollection","geometries":[{"type":"Polygon","arcs":[[0]]}]}},"arcs":[[[115.22446921011499,33.607866983978],[115.22446921011499,29.852609554190323],[117.75358850351438,29.852609554190323],[117.75358850351438,33.607866983978],[115.22446921011499,33.607866983978]]],"bbox":[115.22446921011499,29.852609554190323,117.75358850351438,33.607866983978]}
{
  "type": "FeatureCollection",
  "features": [
    {
      "type": "Feature",
      "properties": {},
      "geometry": {
        "coordinates": [
          [
            [
              115.22446921011499,
              33.607866983978
            ],
            [
              115.22446921011499,
              29.852609554190323
            ],
            [
              117.75358850351438,
              29.852609554190323
            ],
            [
              117.75358850351438,
              33.607866983978
            ],
            [
              115.22446921011499,
              33.607866983978
            ]
          ]
        ],
        "type": "Polygon"
      }
    }
  ]
}
添加TopJSON或GeoJSON数据:
// 1,添加GeoJSON数据源,返回一个Promise
  const dataSource = Cesium.GeoJsonDataSource.load('/polygon.topojson', {
    stroke: Cesium.Color.RED,
    strokeWidth: 3,
    fill: Cesium.Color.PINK.withAlpha(0.5)
  })
  // 2,把数据源添加到viewer中
  dataSource.then(res => {
    viewer.dataSources.add(res)
    viewer.flyTo(res)
  })
(3)KML介绍:
(4)CZML介绍:
CZML格式的数据是一种时态数据,可以做Cesium轨迹动画。
CZML Structure · AnalyticalGraphicsInc/czml-writer Wiki (github.com)

CZML添加一个点简单示例:
const czml = [
  {
    id: "document",
    name: "CZML Point",
    version: "1.0",
  },
  {
    id: "point 1",
    name: "point",
    position: {
      cartographicDegrees: [-111.0, 40.0, 0],
    },
    point: {
      color: {
        rgba: [255, 255, 255, 255],
      },
      outlineColor: {
        rgba: [255, 0, 0, 255],
      },
      outlineWidth: 4,
      pixelSize: 20,
    },
  },
];

const viewer = new Cesium.Viewer("cesiumContainer");
const dataSourcePromise = Cesium.CzmlDataSource.load(czml);
viewer.dataSources.add(dataSourcePromise);
viewer.zoomTo(dataSourcePromise);
<<<<<<< HEAD
CZML制作动态点的动画:
注意:如果想要制作CZML动画,需要打开Cesium动画效果,viewer.shouldAnimate = true
// 添加一个czml动态点
const addDynamicPoint = (viewer) => {
  const czml = [
    {
      id: 'document',
      name: 'CZML Point',
      version: '1.0',
      clock: {
        interval: '2012-03-15T10:00:00Z/2012-03-15T10:05:00Z',
        currentTime: '2012-03-15T10:00:00Z',
        // multiplier: 10
      }
    },
    {
      id: 'point',        // 定义一个packet
      position: {
        epoch: '2012-03-15T10:00:00Z',     // 定义初始时间
        cartographicDegrees: [
          // 时间,经度,纬度,高度
          0, 100, 25, 150000,
          100, 105, 30, 150000,
          200, 110, 35, 150000,
          300, 115, 40, 150000
        ],            // 定义插值时间
        interpolationAlgorithm: "LAGRANGE",    // 拉格朗日插值
        interpolationDegree: 5         // 插值多项式次数
      },
      point: {
        color: {
          rgba: [255, 255, 255, 128]
        },
        outlineColor: {
          rgba: [255, 0, 0, 128]
        },
        outlineWidth: 3,
        pixelSize: 15
      }
    }
  ]
  Cesium.CzmlDataSource.load(czml).then(res => {
    console.log(res)
    viewer.dataSources.add(res)
    // viewer.zoomTo(res)
    console.log(Cesium.JulianDate.toDate(viewer.clock.tick()))    // 输出当前时间
  })
}
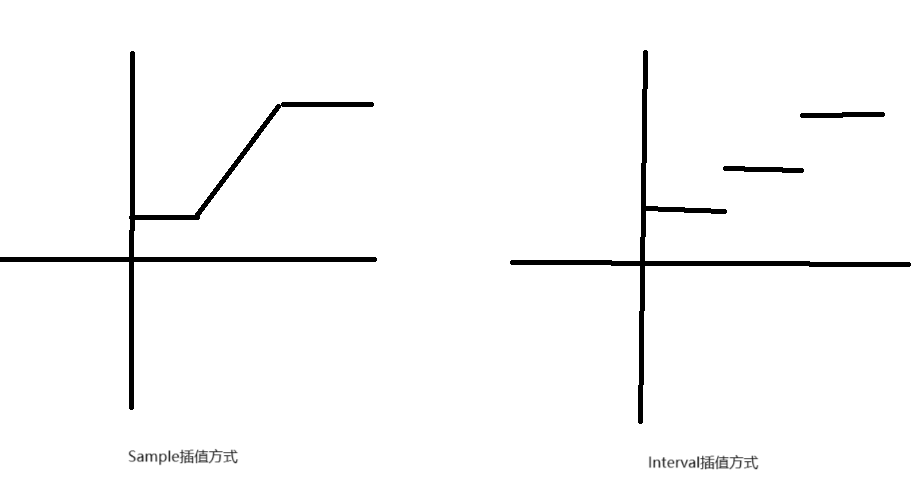
CZML添加动态自定义属性:
czml可以使用两种方式制作自定义属性,一种是sample插值方式,另一种是interval方式。以下是它们的区别:
// CZML添加动态自定义属性
const addDynamicPoint = (viewer) => {
  const czml = [
    {
      id: 'document',
      name: 'CZML Point',
      version: '1.0',
      clock: {
        interval: '2012-03-15T10:00:00Z/2012-03-15T10:05:00Z',
        currentTime: '2012-03-15T10:00:00Z',
        // multiplier: 10
      }
    },
    {
      id: 'point',        // 定义一个packet
      position: {
        epoch: '2012-03-15T10:00:00Z',     // 定义初始时间
        cartographicDegrees: [
          // 时间,经度,纬度,高度
          0, 100, 25, 150000,
          100, 105, 30, 150000,
          200, 110, 35, 150000,
          300, 115, 40, 150000
        ],            // 定义插值时间
        interpolationAlgorithm: "LAGRANGE",    // 拉格朗日插值
        interpolationDegree: 5         // 插值多项式次数
      },
      point: {
        color: {
          rgba: [255, 255, 255, 128]
        },
        outlineColor: {
          rgba: [255, 0, 0, 128]
        },
        outlineWidth: 3,
        pixelSize: 15
      },
      properties:{
        // sample插值方式
        height: {
          number: [
          '2012-03-15T10:00:00Z', 10,
          '2012-03-15T10:05:00Z', 50
          ]
        },
        // interval分段多项式方式
        testDGB: [
          {
            interval: '2012-03-15T10:00:00Z/2012-03-15T10:02:00Z',
            rgba: [255, 255, 255, 255]
          },
          {
            interval: '2012-03-15T10:02:00Z/2012-03-15T10:05:00Z',
            rgba: [255, 255, 255, 254]
          }
        ]
      }
    }
  ]
  // 修改当前时间
  // viewer.clock.currentTime = Cesium.JulianDate.fromIso8601('2012-03-15T10:00:00Z')
  Cesium.CzmlDataSource.load(czml).then(res => {
    console.log(res)
    viewer.dataSources.add(res)
    // viewer.zoomTo(res)
    console.log(Cesium.JulianDate.toDate(viewer.clock.tick()))    // 输出当前时间
    let properties = res.entities.getById('point').properties
    console.log(properties)
    console.log(properties.height)
    // 循环打印自定义属性
    setInterval(() => { 												  	                                                                                console.log(res.entities.getById('point').properties.height.getValue(viewer.clock.tick()))                                                                console.log(res.entities.getById('point').properties.testDGB.getValue(viewer.clock.tick()))
    }, 1000)
  })
}
作业
- 完成上述教程中的案例。
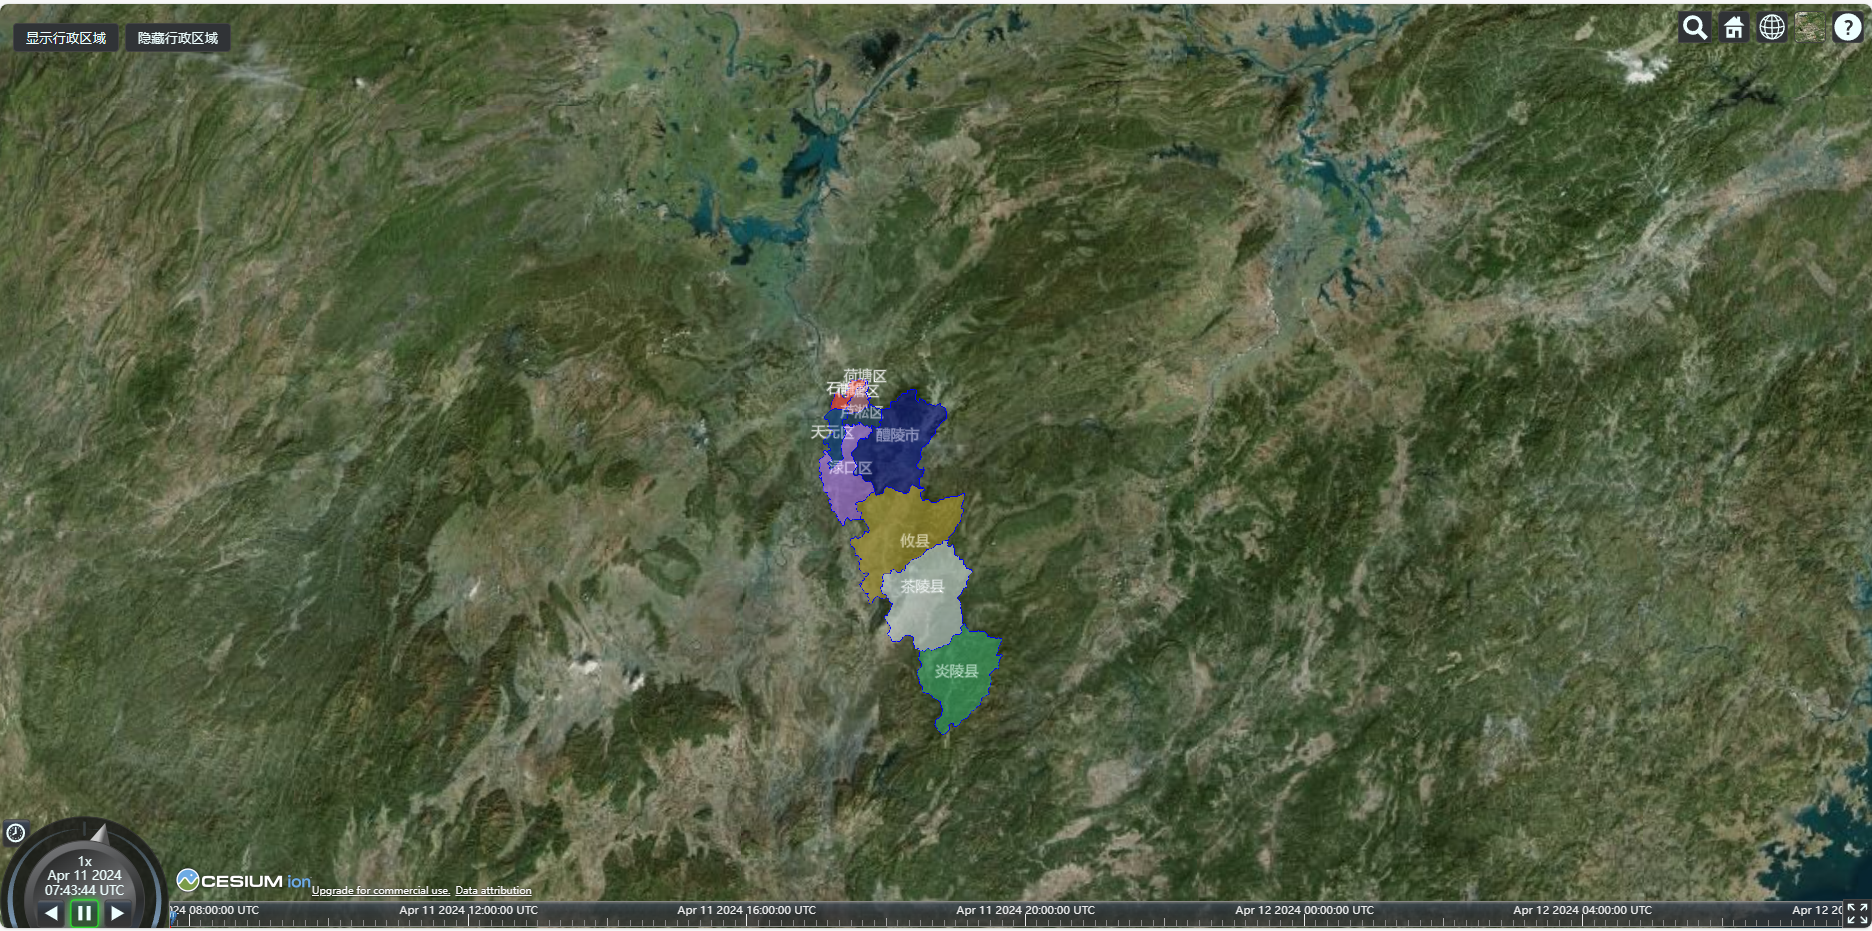
使用DataV.GeoAtlas地理小工具系列 (aliyun.com)下载株洲的行政区域图
- 模仿上面的案例,使用entity的API,在卫星地图上,显示株洲市的行政区域,用不同的颜色划分株洲市每个辖区,并且显示名称。用
Sandcastle.addToolbarButton按钮切换是否隐藏行政区划。
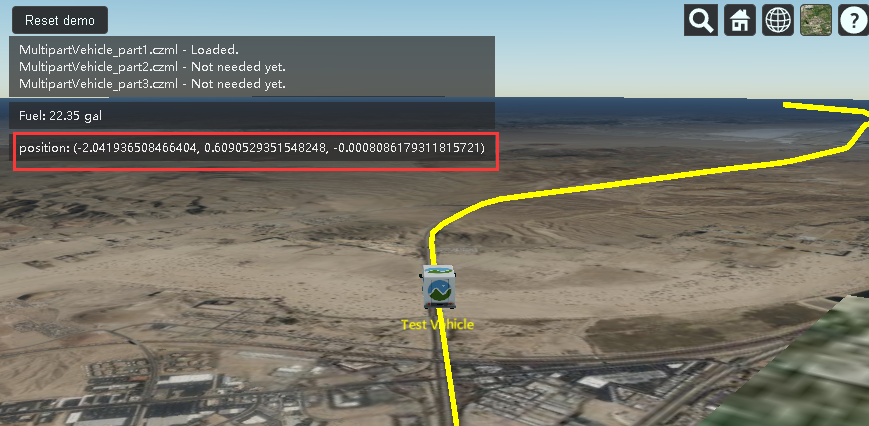
- 仿照示例,制作CZML动画,要求使用billboard在汽车上显示当前行驶的经纬度坐标和高度。坐标可以参照fuel的获取。
const cartesian3 = vehicleEntity.position.getValue(
      clock.currentTime
    );
    if (Cesium.defined(cartesian3)) {
      let position = Cesium.Cartographic.fromCartesian(cartesian3);
      console.log(position)
      posDisplay.textContent = `position: ${position}`;
    }